Section outline
-
-
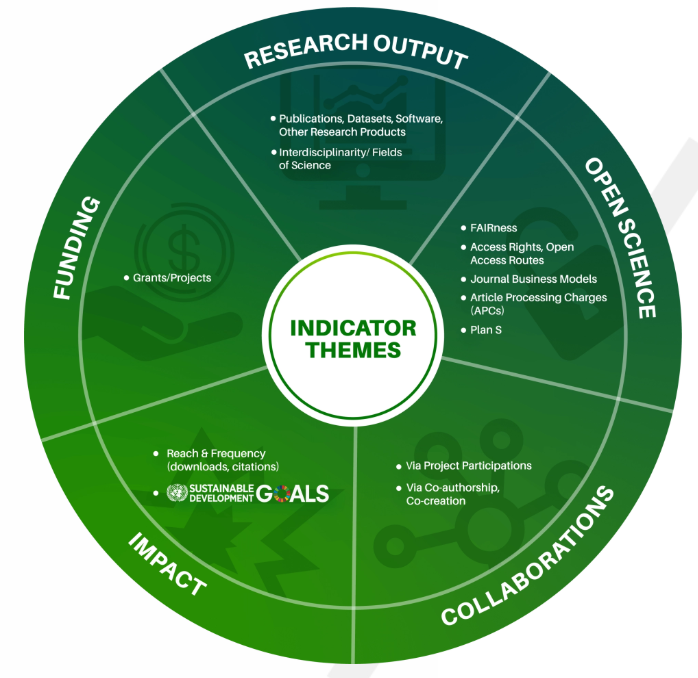
The institutional dashboard of the OpenAIRE MONITOR service is a supplementary tool in enhancing research assessment and decision-making processes for institutions. By providing comprehensive Open Access, collaboration, and impact metrics and indicators, this dashboard offers a nuanced understanding of an institution's research landscape. The detailed insights into Open Access publications enable institutions to gauge their commitment to Open Science, while collaboration metrics shed light on collaborative efforts within the scholarly community. Impact indicators provide valuable information about the reach and influence of an institution's research outputs. Leveraging these dashboards empowers institutions to make informed decisions, fostering a data-driven approach to research management and strategic planning.The institutional dashboard assists institutions on identifying how they fare in Open Science, utilises the collaborating and funding organisations, and how much impact the institutions research output work is making. The institutional dashboard is your go-to tool for understanding and managing your institution's research. With the easy-to-understand metrics broken down to various domains, you can make smart decisions about your research strategy. It's like having a clear roadmap to navigate the world of scholarly communication, collaboration and impact.OpenAIRE MONITOR delivers a rich set of indicators, empowering you to explore and analyze research activities across key themes. With flexible breakdowns and customizable insights, MONITOR helps you track progress, evaluate impact, and align with strategic goals:
-
Funding: Overview of funding in time, including European Commission projects, possibility to filter by program .
-
Research Output: Publications by type, time, data source, publisher, along with indicators for peer-reviewed publications and Field of Science.
-
Open Science: Composite indicators such as openness and findability scores, visualisations for publications by access rights, including over time, as well as insights into datasets and software.
-
Collaborations: Geographic distribution of collaborations and the top 20 collaborating organisations, based on project collaborations.
-
Impact: Indicators for reach and frequency, including total downloads and citations, broken down by access route and Field of Science.
OpenAIRE MONITOR dashboards are powered by the OpenAIRE Graph, a comprehensive collection of research information. Data is aggregated from a large pool of trusted global sources, including repositories, publishers, global registries (Crossref, Datacite, ORCID, ROR, re3data, Patstat, etc.) and research information systems. This data is then enriched and validated through a series of automated processes, including text and data mining and deduplication. This ensures that the OpenAIRE Graph remains a high-quality, reliable source of information for research monitoring and assessment.
OpenAIRE MONITOR uses this data to create interactive dashboards that provide insights into research activities, Open Science uptake, collaborations, and impact. The diagram below illustrates the flow of data from these sources to the OpenAIRE Graph and ultimately to OpenAIRE MONITOR, which generates interactive dashboards.
The OpenAIRE Graph is continuously updated, and user feedback is incorporated to improve its quality and relevance.
ObjectivesThe outcomes of the session are designed to equip participants with the skills and knowledge needed to make the most out of the institutional dashboards in OpenAIRE MONITOR.- Understand how the institutional dashboard provides insights about your institution's research landscape.
- Navigate and interpret Open Access metrics for scholarly impact.
- Identify collaboration patterns and networks of your institution.
- Evaluate metrics to assess the influence of your institution's research.
- Examples of how to use the institutional dashboard for informed decisions on research strategy and collaborations.
Learning Outcomes- Efficiently navigate to the institutional dashboard for relevant insights.
- Understand and interpret Open Access metrics and access rights.
- Collaboration Identification: Identify and analyse collaboration patterns among institutions.
- Impact Evaluation: Evaluate impact indicators to gauge research influence.
-
-
Training slides on navigating the research landscape with OpenAIRE Monitor, emphasizing institutional tracking of outputs to unlock research excellence.
-
GraspOS training website featuring events, resources, and guidance on Open Science-aware assessment tools, indicators, and services for stakeholders.
-
Recording of the OpenAIRE Monitor webinar (19 Dec 2023) on using institutional indicators to map research excellence and navigate the scholarly landscape.
-
Article summarizing the OpenAIRE Monitor training webinar, focusing on institutional indicators and their role in assessing research impact.
-